The People’s Republic of China, is a sovereign state situated in the Eastern Asia. China is the world’s most populated country, with a population of 1.357 billion. With approximately 9.6 million square kilometers area, China is the world’s second-largest country by land area after Russia,and either the third or fourth-largest by total area, deferring due to the method of measurement.According to 2013 data, it is the world’s second-largest economy by both nominal total GDP and purchasing power parity (PPP), and is also the world’s largest exporter and importer of goods. China is a nuclear weapons state which recognized by world community and has the world’s largest standing army, with the second-largest defense budget(Central Intelligence Agency).
Graph1. Real and nominal GDP of China during1995-2013
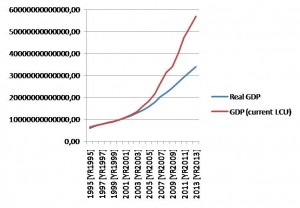
According to World Bank China’s 2013 real GDP is more than 34 trillion dollar and nominal GDP is 56 trillion yuan. In dollars it is 9.2 trillion, which is less than only USA’s GDP. Also referring to the graph1 above, since 1995 till today we see sharply increase in both GDP.The most important reason is the implemented reforms in order to open and liberalize the economy, also natural resource wealth, the other is that in recent decades most of the great US or European companies have been inclined to China as a cheap labor country such as Apple. Economic reforms in China were implemented in several stages including policies such as: permission for entrepreneurs to start business, privatization, price control, protectionism and so on.
Graph2. Inflation (based on CPI and GDP deflator) in China during1995-2013
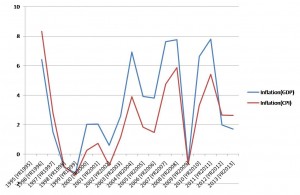
According to graph 2, inflation is changing between -1.4 and 8.3 (based on CPI). We observe several fluctuations during these years, inflation, deflation. At first glance inflation in China seems out of control. Chinese monetary policy has generally experienced the following three stages since 1984. Inthe first stage (1984–1992), China’s monetary policy is still in exploration, flexibleand loose/tight monetary policies are taken; in the second stage (1993–1996),monetary policies are constantly optimized and moderately tight monetary policiesare performed; in the third stage (1997–present), relatively mature and prudentmonetary policies are implemented(H).Although in the third stage mature policy is being implemented, we still observe fluctuating inflation during recent years. This is the result of the China government policy which was implemented in order to rescue China from finance crisis 2008. This policy included holding local currency weak, but at the end it caused the government to lose control over inflation. The founder of Soros Fund Management, George Soros recommends vice versa: “It would be very advantageous to allow the currency to appreciate as a way of controlling inflation”(Bloomberg Business).
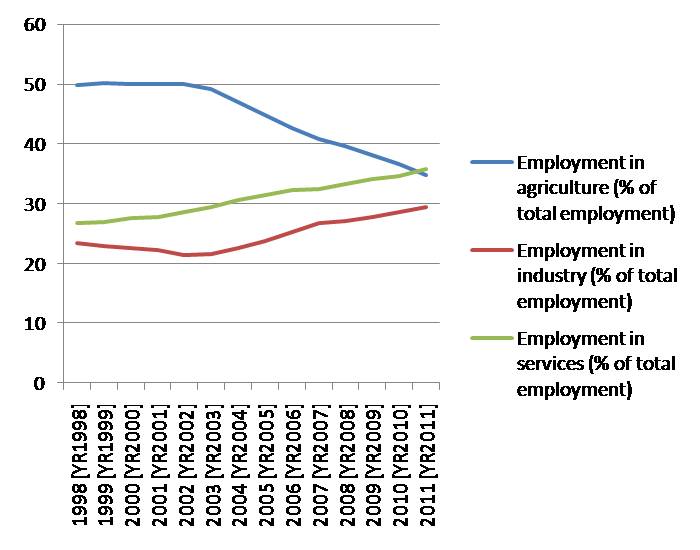
Graph3. Employment shares among sectors in China during1998-2010
Graph4. Employment shares among sectors in Azerbaijan during1998-2012
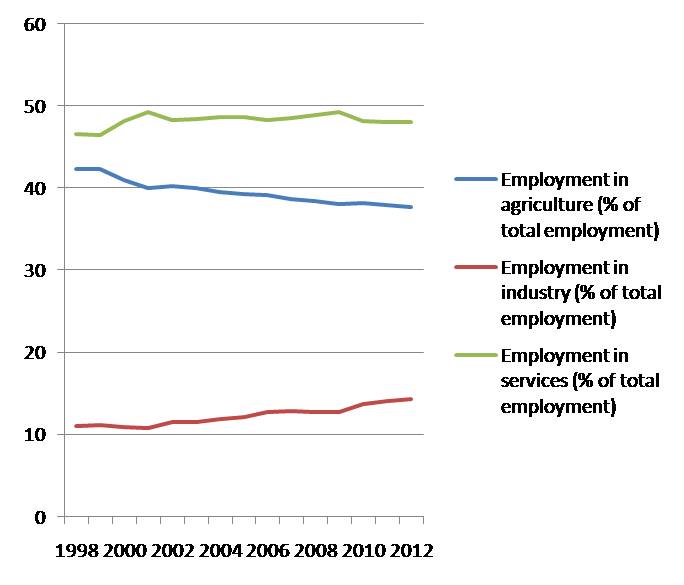
This data shows that in China the majority of people, about 50% of them were working in agricultural sector since 1998 however this tendency is changing after 2003 year and agriculture begins to lose dominance in labor market. The second popular field is service sector with about 30% indicator. It is shown that this field is gaining popularity gradually since 1998 till 2011. Also the interesting fact is that, while agriculture has diminishing and service has increasing tendency, these two indicators intersect in 2011 while both are about 35%. Similar with Azerbaijanemployment in industry is getting popularity through these years. In comparison with Azerbaijan’s data China’s labor market seems more dynamic. Different from China in Azerbaijan the rank of these sectors is as: service, agriculture, industry. Also the percentages are close to each other.
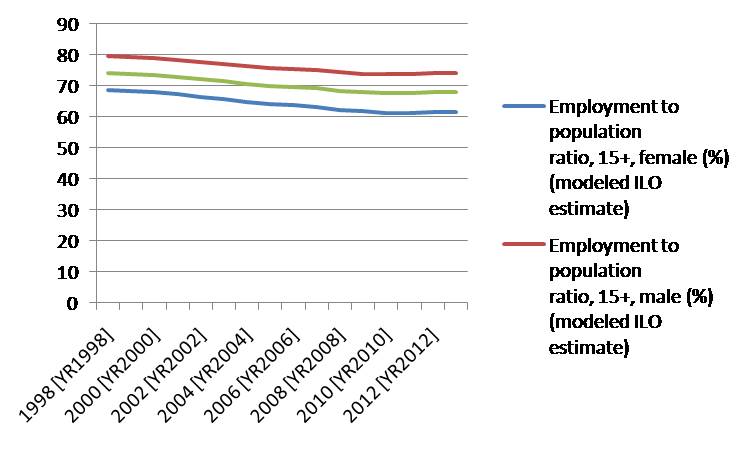
Graph5. Employment shares among genders in China during1998-2012
Graph6. Employment shares among genders in Azerbaijan during1998-2012
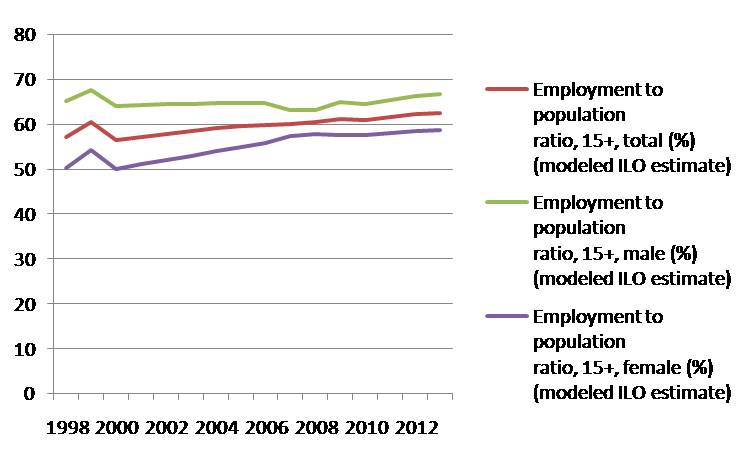
This graph shows changes in proportion of employed people within total working age population, older than 15 years old. At first glance we can see gradual decreasing scale in total, male and female employment rate in China during these years. As China’s birth rate declined due to family planning restrictions in the 1980s and 1990s, due to the number of new employees entering the workforce also started to decline in the following decade. Also, students started to stay in school longer rather than seek employment directly after graduating from middle school(China Labour Bulletin, 2012). These factors have combined to create acute labor shortages in major manufacturing centers as shops, restaurants, hotels and factories all struggle to hire and retain staff(China Labour Bulletin, 2012).The total employment to population ratio is changing between 75% and 68%. For female employment this indicator is between 69% and 61%, for male employment is 80% and 75%. In comparison with Azerbaijan this graph seems more stable, because in Azerbaijan more fluctuations are observed during these years. In both countries men dominate in labor market. But unlike China, in Azerbaijan employment rate of people is increasing.
Graph7. Share of export in GDP in China during1995-2013
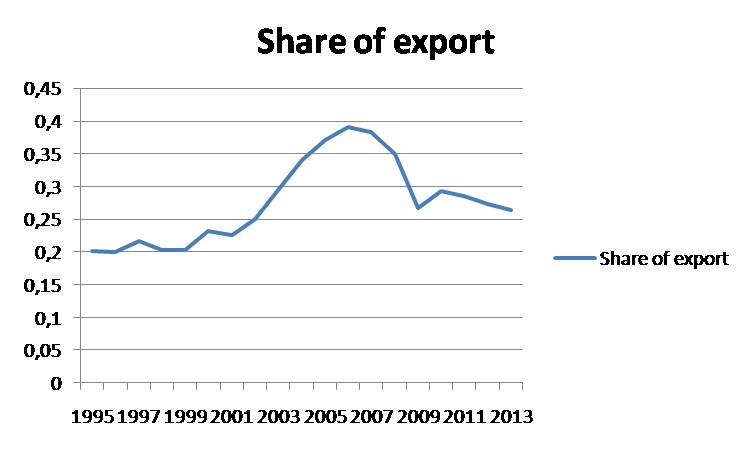
As seen from the graph7 export constitutes 0,2%-0,4% of China’s total GDP. China’s exported goods and services culminate in 2006 when it becomes 40% of gross domestic product. China’s biggest trade partner is United States which buys 17% of China’s total exported goods. Hong Kong, Japan, South Korea, Germany and other economy superpowers share the rest places after United States in trade with China(Workman, 2015). During recent years electronic equipment(24.4% of total exports), machines, engines(17.1%), furniture, lightening(4.0%) dominate among the exported goods by China(Workman, China’s Top 10 Exports, 2015).
Graph8. Share of import in GDP in China during1995-2013
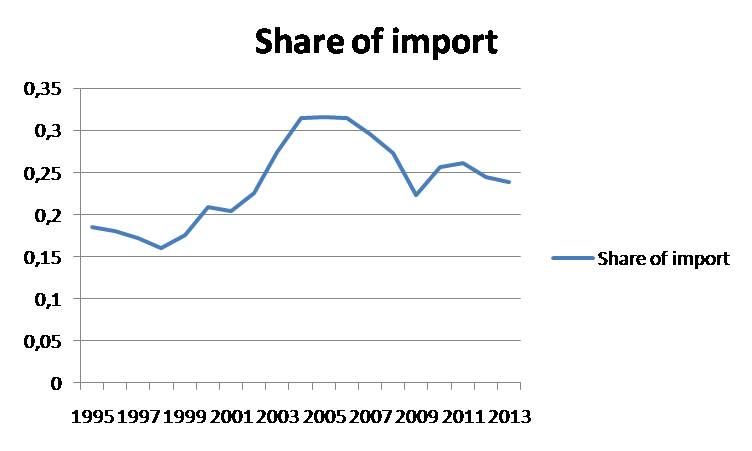
During 1995-2013 China’s import is changing between 0,17% and 0,32% in its GDP.Japan, US, Germany, France, UK, Russia, Spain are the most important import partners of China from which it gains needy imports(Workman, China’s Top Import Partners, 2015).
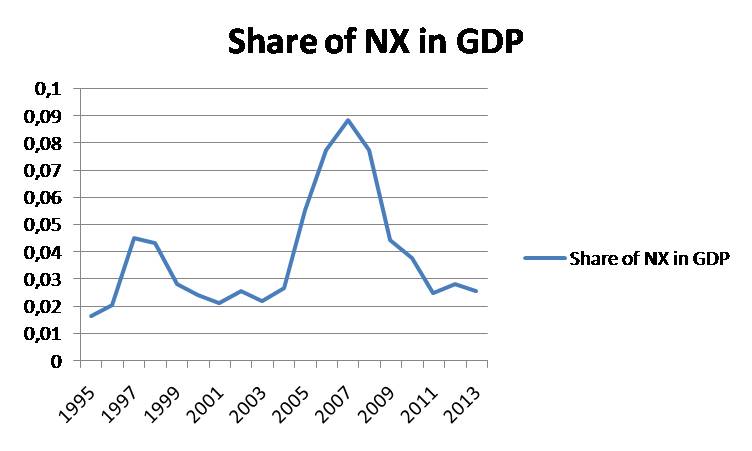
Graph9. Share of Net export in GDP in China during1995-2013
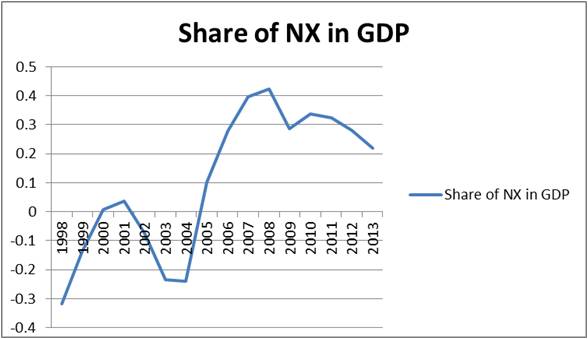
Graph10. Share of Net export in GDP in Azerbaijan during 1998-2013
Graph11. Share of import + export (openness of economy) in GDP in China during1995-2013
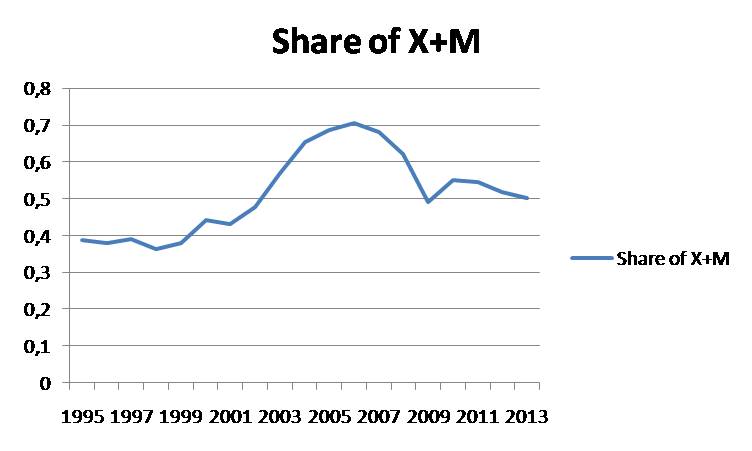
After investigating import and export shares in GDP of China, it is evident that during recent years China has been net export country where export share is greater than import share. Similar with Azerbaijan after 2008 net export is decreasing which can be explained by World Economy Crisis. Referring to the data we can say that since 2005 Azerbaijan is exporter country. From the last graph we can consider that China is very open to international trade alike with Azerbaijan.
Graph12. Unemployment rate in China during 1995-2013
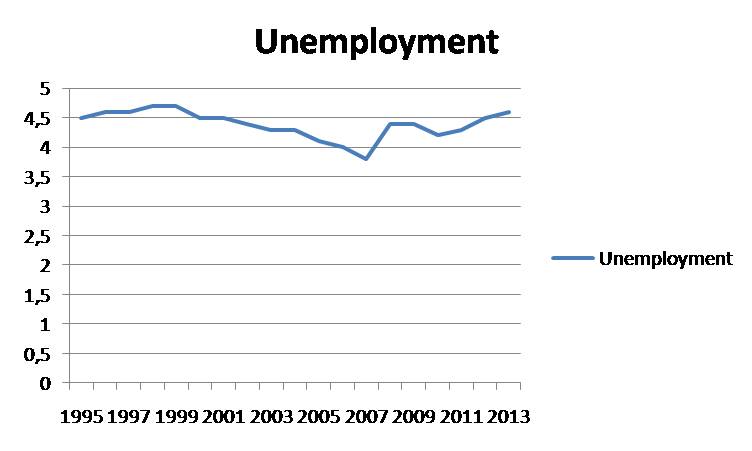
As China is one of the world’s economy giants, it would be interesting to analyze unemployment rate there. According to the graph above we observe that unemployment rate in China is so stable and almost horizontal line. Unemployment rate is fluctuating between 4 and 4,5% during 1995-2013 years. Even when an estimated 20 million migrant workers were laid off in the wake of the global economic crisis in 2008, the official unemployment rate only increased to 4.3 percent or about ten million workers.Although China is the biggest populous country in the world, how it can achieve stable unemployment rate? The answer is simple. This is because the official unemployment statistics only include urban workers who have registered as unemployed. Urban workers constitute less than 66% of the urban working population(China Labour Bulletin, 2012). They have more protective job security than migrant workers and are less likely to be fired during company restructuring or downsizing(China Labour Bulletin, 2012).
Thus since initiating market reforms in 1978, China has changed the system from a centrally planned to a market based economy and experienced fast economic and social development(China, 2015).With 9.2 trillionGross domestic product and 1.357 billion population China recently became the second largest economy and is increasingly playing an important and influential role in the global economy(China, 2015).
Yet China remains a developing country (its per capita income is still a fraction of that in advanced countries) and its market reforms are not finished yet(China, 2015). World bank data shows that about 98.99 million people still lived below the national poverty line with the second largest number of poor in the world after India, poverty reduction remains a fundamental problem waiting for solution(China, 2015).
Fast economic increase has brought on many problems as well, including high inequality; challenges to environmental sustainability;rapid urbanization; and external imbalances. China also faces demographic pressures related to an aging population and the internal migration of labor. Therefore significant policy adjustments are required in order for China’s growth to be sustainable(China, 2015).
BY: LEYLA ABBASLI
Bibliography
Bloomberg Business. (n.d). Retrieved from http://www.bloomberg.com/news/articles/2011-04-11/china-inflation-somewhat-out-of-control-george-soros-says
Central Intelligence Agency. (n.d.). Retrieved from https://www.cia.gov/library/publications/the-world-factbook/geos/ch.html
China. (2015, March 25). Retrieved from The World Bank: http://www.worldbank.org/en/country/china/overview
China Labour Bulletin. (2012). Retrieved from http://www.clb.org.hk/en/content/employment-china
H, Z. (n.d.). The study of effectiveness and appropriateness.
Workman, D. (2015, March 24). China’s Top 10 Exports. Retrieved from http://www.worldstopexports.com/chinas-top-10-exports/1952
Workman, D. (2015, April 19). China’s Top Import Partners. Retrieved from http://www.worldstopexports.com/chinas-top-import-partners/723