Introduction
In 2015, the expansion of the US economy accompanied with improved employment rates led the FED to switch to contractionary monetary policy. On the other hand, the second largest economic power-China encountered a lower long-term economic growth rate with a fall in exports, and thereby adversely affecting global economic activity. Moreover, the rapid decline of prices in global fuel markets, owing to fundamental and political reasons, resulted in an economic downturn in countries reliant on their fuel exports, while importers experienced a higher economic activity in parallel with lower inflation expectations. Accordingly, new economic conditions emerged in the second half of 2014, persisted their negative impact on the economic dynamics of Azerbaijan during the following year. The ineffectiveness of an economic diversification policies in the country were revealed in the context of the fall of fuel prices. The economic management system, rooted in large-scale oil revenues in the last decade lost its regulating capacity, and subsequently the government decided to devalue its currency by 25.1% (21.02.2015) to prevent a rapid depletion of the reserves. This devaluation had a high pressure on real sector, which was adapted to a fixed exchange rate regime for a long period of time. Consequently, the debts accumulated by businesses and households increased, prices of final consumption and production dependent on imports rose leading to a lower domestic demand.
Moreover, there were cuts in the budget expenditure, the minimum lending in the banking sector, and lower economic initiative.
Since the monetary and economic policies were originally anchored to the oil price of 90 USD, the average of 53.4 USD resulted in an economic imbalance, and ultimately leading to the second sharp devaluation at the end of the year (21.12.2015). That is to say, the Central Bank could no longer
pursue the fixed exchange rate regime, and switched to the floating regime. As a result, national currency lost its value by 49.4% during the year.
The devaluation of the national currency led to lower value-added created in the economy, lower per capita income and lower monthly wages in terms of USD, by worsening the global economic position of Azerbaijan. Furthermore, a fall in the income levels of population and the increased debts in terms of foreign currency brought about a crisis in the banking sector by aggravating the credit repayment ability of citizens. Since 90% of exports were dependent on oil, foreign trade balance and balance of payments were adversely affected. Simultaneously, the country lost more than 20% of its strategic exchange reserves.
Our research group analyses the impact of recent events on the macroeconomic environment-on GDP, income of population, economic activity and labour market, as well as on official exchange reserves, foreign trade balance, investment environment, banking sector. The research was conducted based on the data of official institutions and international information sources.
1. Macroeconomic situation
1.1 Economic Value Added
The sharp decline in the international oil prices in 2015 has also negatively influenced the economy of Azerbaijan, after the prolonged expansion owing to higher oil prices. In 2015, the value-added created in the economy increased by 1.1% in real terms1, being 54.4 billion AZN. Nonetheless, as a result of the devaluation of national currency by 98.7%2 during the reporting year, the GDP in terms of USD experienced a 27.7% contraction compared to the previous year (75.2 billion USD, 2014, World Bank3). That is to say, during last year the value-added created was 54.35 billion USD4.
It should be noted that following the expansion in last decade Azerbaijan was able to increase its share in the Caucasus economy from 54.1% in 2005 to 74.6% in 2013 (SSCRA, 2016). To put it another way, Azerbaijan accounted for 75 dollars out of the total 100 dollars of the value-added in the economy of the Caucasus in 2013. This number was 72.7%5 in 2014, subsequently losing its share of 3/4 in the region in 2015 (CIA, 2016).
Diagram 1. GDP and the dynamics of GDP per capita
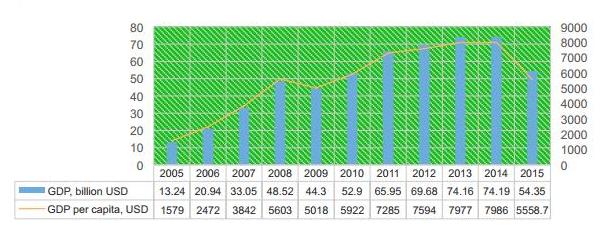
As illustrated in the Diagram 1, the economy encountered two major contractions during last 11 years: the first in 2009 due to the Global Financial Crisis; and the second owing to the drastic fall in the international oil prices in 2015. Thus, both can be attributed to the drastic fall in oil prices. Notwithstanding, in 2015 economic depression was deeper leading to the devaluation of national currency. In 2015, the GDP per capita was 5703.7 AZN or 5558.7 USD6, which is 30.4% less than the previous year and nearly the same with 2010. However, in the context of oil revenues the GDP per capita increased fivefold during the period of 2005-2014.
Azerbaijan economy, being highly rich in hydrocarbon resources, can be divided into two sectors:
(i) Non-oil sector
(ii) Oil sector
In 2015, the non-oil sector constituted the 69.3% of the total value-added. This is 8.4 percentage points higher than in 2014 (60.9%, 2014). According to the State Statistical Committee of the Republic of Azerbaijan, there was 4% rise in non-oil GDP7. Notably, similar rise was recorded in 2001 (68.7%, SSCRA, 2016). During the subsequent period the position of non-oil sector weakened considerably, following the increased oil production after the Baku-Tbilisi-Ceyhan put into service.
Diagram 2. The share of non-oil sector in the economy, in terms of percentages
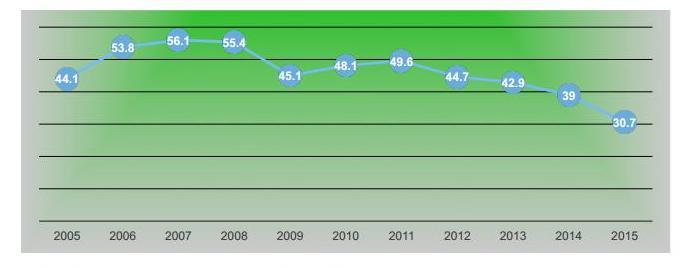
The non-oil sector encountered the lowest share with 43.9% in 2007. The end of oil boom in 2011 led the non-oil sector to restore its position. On the whole, during previous years economic growth in the country is attributed to the expansion of non-oil sector. The growth in non-oil sector is derived
from increased government expenditures, which in turn, financed by oil revenues. That is to say, during 2015 one of the major impediments to growth was reductions associated with budget spending. Although budget spending was projected to be 21 billion AZN or 13.53 billion USD (converted based on average annual exchange rate 1 USD=1.0261), it was 15.7% less, being 17.3 billion USD8. Therefore, taking into consideration the financial implications, there has been a 2.95 billion USD reduction. This in turn, has a negative impact on the recent trend of the economic growth, financed by budget expenditure.
1.2 Income of population
In 2015, the income of population was 41.7 billion AZN or 40.7 billion USD9 (convertation into USD is same with the average annual exchange rate used by the SSCRA for other indicators, 1 USD=1.0261) which is 19.8% lower compared to the previous year (2014, 50.5 billion USD10). While
in 2014 the income devoted to the final consumption constituted the 68.8%, in 2015 this was 75.7%. Furthermore, in 2015, 2.9% of personal incomes were allocated towards the repayment of credits, being 0.4% higher than previous year (2014, 2.5%, SSCRA). As stated by the State Statistical
Committee, during 2015, 15.9% of income has been devoted to savings, decreasing from 20% recorded in 2014.
Diagram 3. Income per capita, in terms of USD
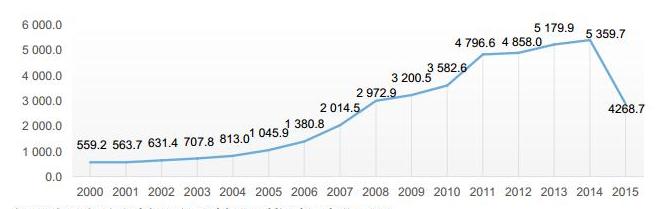
The average income per person was 4380.1 AZN or 4268.7 USD 11 in 2015, being lower than in 2011. As presented in the Diagram 3, during last 15 years (the period of 2000-2014), the income per capita accomplished an uninterrupted rise, but declined drastically in 2015. It should be noted that, the maximum was recorded in 2014, when the income per capita reached the highest level in the country. It can be observed that, starting from 2006, when the BTC pipeline was launched, the income levels rose considerably, but fell down in 2015 due to the drastic fall in oil prices. Thus, it can be concluded that, there has been a dominant role of oil revenues in income levels of the population during previous years.
1.3 Labour market
According to the official data available in December of 2015, the number of paid workers, declined by 0.8%, being 1 million 504 thousand (1 516.1 thousand people, 31.12.201412). This decrease was recorded both in public and private sector13. That is to say, based on the data available in December 1, in the public sector the number of paid workers was 879.4 thousand, while in private sector it was 624.6 thousand.
Diagram 4. Average monthly salary, in terms of USD
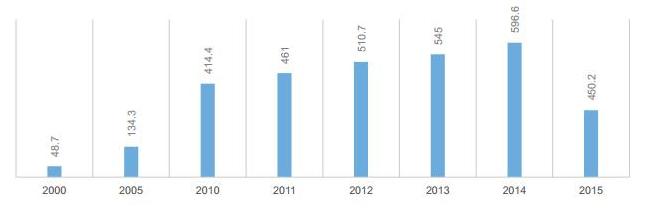
In 2015, the level of average monthly salary increased by 4.6% in terms of national currency (462 AZN), notwithstanding it decreased by 24.5% in terms of dollars, being 450.2 USD14 (Note: average exchange rate was 1 USD=1.0261)(596.6 USD, 2014). Therefore, Azerbaijan has lost its status of
“middle income country”. The Diagram 4 indicates that, during the period from 2000 to 2014 the average monthly salary was constantly in an increasing trend. Accordingly, during this period it increased a 12 times, and reaching its peak in 2014. Yet, the drastic fall recorded in 2015 had a
negative impact on the social welfare and the domestic demand of population. Regarding to the worsening economic dynamics and sharp devaluation of national currency, entrepreneurs faced substantial borrowing costs, by deepening the impact of recession in real sector. Some entrepreneurs encountered bankruptcy, while others decreased the number of their employees. There is no official data available about the number of closed workplaces, but observations show that the unemployment rate increased compared to the previous years. In this spirit, the head of the state expressed his discontent about the closure of 40 thousand workplaces, in the conference on social and economic development indicators in 201515.
1.4 Foreign trade
The foreign trade turnover in 2015 decreased by 33.4% compared to the previous year, being 20.6 billion USD. This noticeable contraction in foreign trade turnover was due to the shrinking of exports16. In other words, the amount of exports decreased to 10.6 billion USD, or by 48.7% during
2015. The major reason of this plunge is the sharp drop in international oil prices. Comparing to 11 months’ of 2014, in 2015 the volume of oil, oil products and gas exports diminished by 53.8%, being 9.1 billion USD (2014, 19.77 billion USD, SCCRA).
In contrast to exports, there was an increase in imports. That is to say, during 11 months’ of 2015 the volume of imports rose by 1% from previous year, being 8.2 billion USD17. Considering macroeconomic situation has not changed considerably at the last month of 2015, the final outcomes of 2015 can be grounded on 11 months’ trend.
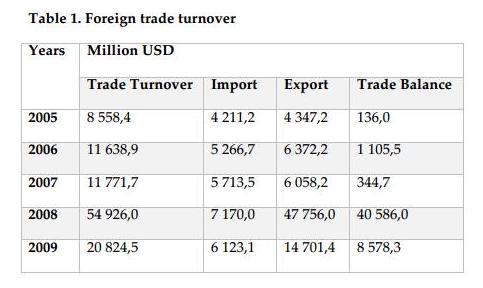
During the years following the opening of the BTC pipeline, the foreign trade turnover rose by 6.4 times and reached its peak in 2008 with 54.9 USD. While the increase in imports was 70% during the period, exports rose by 11 times. Thus, in 2008 the trade balance was 40.6 billion USD. The fall
in the price of energy resources led the trade balance to decrease to 8.6 billion USD. The end of the oil boom in 2011 and corresponding decline in oil production, are the main factors bringing about lower exports, and therefore decreasing trade balance. Moreover, increasing government expenditure and accompanied infrastructure projects during 2013 resulted in 1 billion USD more imports from previous year, ultimately worsening trade balance. Nonetheless, it is predicted that, in 2015 trade balance decreased by 6 times, being 2.2 billion USD. Considering many experts put forward that the imports are even higher in reality, in 2015 trade balance followed a negative tendency.
1.5 Investment Environment
Despite Azerbaijan entered a phase of stagnation from the second half of 2015, the World Bank did not change on the position of Azerbaijan in the “Doing Business” index of the country (ranks 63rd among 189 countries18). According to the report, while there is a deterioration in the credit
availability, the electricity access, tax collections, customs procedures, registration of property, an improvement is observed in starting business, getting permission for construction, and especially in defending foreign investments… in general, when comparing with previous years, the
importance of foreign capital increased in 2015. The president stated that, the investment to the country amounted to 20 billion USD, and the share
of foreign investments was 50% in 2015 in the conference about the social and economic outcomes of 201519.
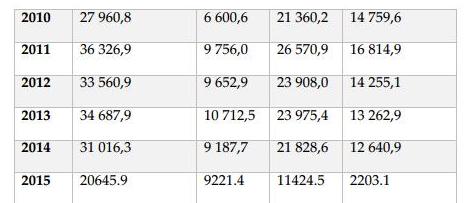
In 2015, the level of investment in economy dropped by 28.3% (or 7.9 billion USD) (2014, 27.91 billion USD, SSCRA). As illustrated in the graph below, during the period 2000-2014 the volume of investments rose by almost 20 times. But, there was a decline in 2009 and in 2015, and both can be
attributed to the fall in oil prices and accompanying recession. That is to say, Azerbaijan, known for its oil resources, becomes less attractive for investment purposes, when there is an oil slump.
During 2015, there was a considerable fall in both foreign and domestic investments, 14.5% and 38.3% respectively. The underlying reason for decreasing domestic investments is the devaluation of national currency. Additionally, higher risks had negative impact on economic initiatives that
can be considered the second reason of lower investments. Based on estimations, in 2015 about 39% or 8 billion USD of the total investments was directed to the oil sector20. This is 18.8% higher than previous year (6.73 billion USD, 2014, SSCRA). The major source of investments directed to the oil sector is foreign investments (Note: the share of non-oil sector investments in foreign investments was 14.9%, SSCRA, 2016). To put it another way, foreign investments were mainly directed to oil sector similarly as previous years.
Diagram 5. The dynamics of foreign and domestic investments
It should be mentioned that, international credit rating agencies such as “Fitch Ratings”, “Standard and Poor’s” keep the rating of Azerbaijan as “BBB-“. Nonetheless, there is a high possibility of being downgraded in the near future that can undermine foreign investment flows.
1. The State Oil Fund of the Republic of Azerbaijan in 2015
The State Oil Fund of the Republic of Azerbaijan projected to have 13.06 billion USD in revenues, and 15.06 billion USD21 in expenses (with official exchange rate on 30.12.201422), based on average annual price of 90 USD per barrel in 2015. However, in 2015 the average annual oil price was 53.4
USD that meant a serious decline in revenues of the Fund. Consequently, expenses were cut in order to reduce budget deficit and to retain the reserves of the Oil Fund.
During 9 months of 2015, the revenues of the Fund were 5.25 billion USD, while the expenses were 6.06 billion. During the period, the amount of the transfers from the Fund to the budget was 5.35 billion USD23 (converted as 1 USD=1.05 AZN, since the Oil Fund had completed its annual
transfers to state budget before the second devaluation). Thus, the projected revenues and expenses of the Fund reduced significantly. According to the Ministry of Finance, transfers of the Fund to state budget during 2015 constitute 7.7 billion USD24, which is 41.8% lower than the projected number. Although, devaluation that happened in February 2015 reduced the financial burden of the Fund, for the first time, the Oil Fund failed to meet its obligation before the state budget. As a result, revenues of the state budget were 11.8% lower. Therefore, the amount of transfers to the state budget was reduced by 4.27 billion USD, or by 35.2% in 2015 compared with previous year.
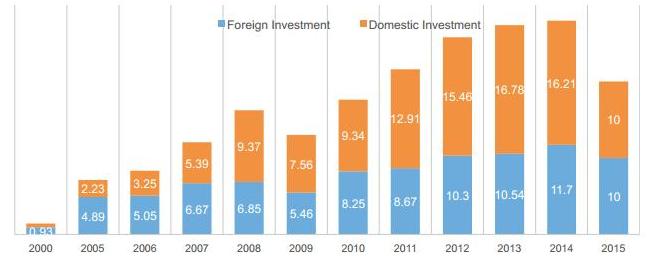
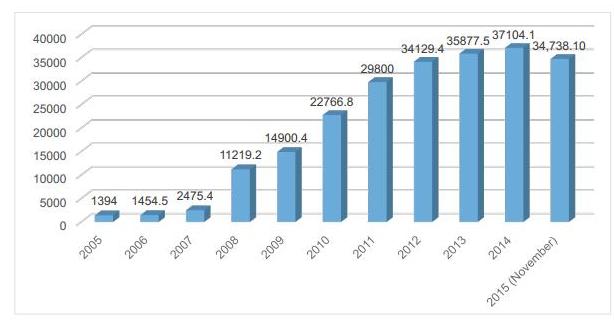
Diagram 6. Transfers from the SOFAZ to state budget
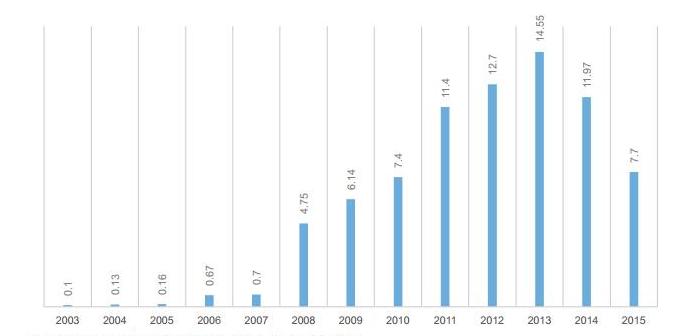
As presented in the Diagram 6, starting from 2006, the amount of transfers from the Fund to the state budget rose rapidly, and reached its maximum in 2013. To put it another way, during the period 2005-2013 the volume of transfers increased by 91 times. In 2014 the government reduced the amount of transfers with the purpose of saving. Yet, the sharp decline in fuel prices in 2015 necessitated the reduction.
Based on the information available on 2015 October 1, in the year 2015 the assets of the Fund decreased by 6.38%, being equivalent to 34.7 billion USD25 (01.01.2015, 37.1 billion USD, SOFAZ, 2016). Taking into consideration that only the transfers to state budget from the Fund constituted
2.35 billion USD in the last quarter of the year the depletion of assets continued in the fourth quarter as well.
Diagram 7. Assets of the Oil Fund, billion USD
During the period 2005-2015, the assets of the Oil Fund decreased for the first time in 2015. It should be noted that, the CESD recommended reducing transfers to state budget in 2011. According to the CESD, the rapid depletion of oil funds should be avoided to meet the demand in
the period of lower oil production of 2010-2025. Moreover, the think tank also underlined that the fuel prices are determined out of the control of Azerbaijan, and therefore any fall in oil prices would have a negative impact on the fiscal policy of the country26.
2. Monetary and exchange rate policies
3.1 Exchange markets and the exchange rate of the manat
In 2015, the exchange rate policy of the Central Bank was based on the decreasing foreign exchange supply and its increasing demand27. The sharp decline in the oil price together with the devaluation of national currencies of oil-rich countries resulted in a considerably increased demand of foreign exchange in financial markets in Azerbaijan. That is to say, during 9 months’ of 2015 the total volume of transactions in exchange markets rose by 1.8 times, and 91% of these transactions were in USD. This is 1.8 times higher compared with the respective period of 201428. Altogether, the value of transactions in USD during 9 months was 54 billion, while transactions in EUR rose by 2.1 times. Within the 3 quarters of the reporting year, the demand of population for USD, as a net cash of foreign currency, increased by 61.7%, and the highest demand was observed during the first
quarter. In other words, the first quarter accounted for 63% of USD, and 38% of EUR sold in cash during 9 months (Source: Central Bank). In order to meet the demand, the Central Bank conducted an intervention amounted to 4 billion USD during three months, including December of 2014,
January and February of 2015.
First Devaluation-As a result, the Central Bank lost 27.6% of its exchange reserves during a short period. In order to implement a quick exchange rate policy, and to prevent the rapid reduction of exchange reserves, the Central Bank decided to switch to bi-currency basket represented by EUR
and USD from the 16th of February 201529. The rationale behind this policy was on the one hand to be able manoeuvre about the changes in EUR-USD exchange rates, and on the other hand, to adjust a currency basket based on the balance of payment transactions.
A few days later, on February 21, 2015, the Central Bank decided to implement 33.55% (25.1% based on international methodology) devaluation, setting the rate as 1 USD=1.05 AZN30. The Central Bank disclosed the purpose of its decision: “This decision is based on the purpose of creating additional incentives for diversification of national economy, to reinforce international competitiveness and export potential, and therefore, to ensure the strategic sustainability of balance of payments and solvency”31. Experts say that the Central Bank was not able to put into effect the
right exchange rate policy in time, and pointed to the poor dynamics of economic diversification in explaining this devaluation.
Diagram 8. Official exchange reserves of the Central Bank, billion USD
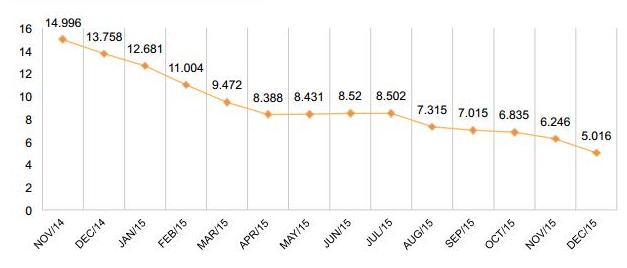
In spite of positive the statements by the government; the devaluation decreased the confidence in the national currency. Consequently, this factor marked the deepening of the dollarization process. The savings and deposits of households and businesses, as well as lending were converted to and
conducted in foreign currency. During the 10 months of the first devaluation, the exchange reserves declined by 43.2% or by 4.76 billion USD. It can be observed from Diagram 8, that during 14 months exchange the reserves followed a negative trend, only with a slight increase in May and
June. Following the switch to a flexible exchange rate regime in Kazakhstan in August, the demand for foreign currency rose once again. That is to say, the expectations of similar decision in Azerbaijan got bigger, owing to a similar economic structure of these countries.
Diagram 9. The exchange rate of national currency and Brent oil price
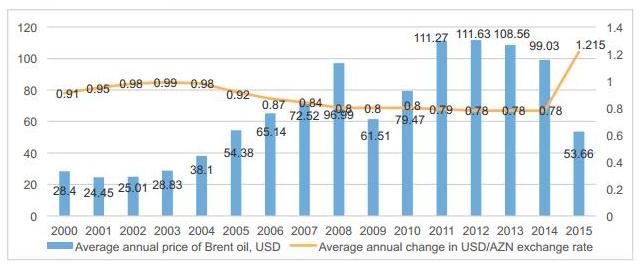
The Diagram 9 presents the correlation between the exchange rate of the national currency and the oil prices. During the period of rising oil prices in 2001-2014 the national currency became stronger by 21%. Nonetheless, following the drastic fall in the oil prices in the last quarter of 2014 the
balance of payments of the country was influenced adversely, and in 2015 the national currency lost its value by 24% on average.
After the first devaluation, the Central Bank tried to reduce the amount of national currency in circulation in order to limit the demand for foreign currency. During this period, the banking sector highly restricted lending in manats. On the other hand, during the execution of the state budget,
the Ministry of Finance implemented a 3.1 billion AZN (2.95 billion USD) reduction in unprotected expense directions (Samir Sharifov, Minister of Finance), sharply decreasing the national currency inflows into circulation. The money market shrank by 70%, or from 14.71 billion USD to 4.4 billion
USD comparing with the beginning of 201533.
Floating exchange rate regime- The incessant fall of the oil price, the reduction of reserves to the minimum, and the decision of a U.S. Federal Reserve System to start to a contractionary monetary policy after 9 years, all limited the potential manoeuvre of the Central Bank and government. Thus,
on 21st of December in 2015, there was new and more serious devaluation. The Central Bank underlined its incapacity to manage the current situation, and announced the switch to the floating exchange rate regime34. According to the statement of the Central Bank, the first devaluation was adjusted to 50-55 USD price of oil35. The exchange rate announced, for the day of switch to the flexible exchange rate regime, was 1 USD=1.55 AZN, which means a devaluation of national currency by 49.4% during the year. It should be noted that, in April 2015, the Center for Economic
and Social Development projected that, if a barrel of oil declines to less than 40 USD, the Central Bank will implement the next devaluation at the end of the year36. Following the second devaluation, there was a continuous weakening of the national currency, and due to the limited participation of the Central Bank in currency markets, the actual conversion rate was 1 USD=1.85 AZN.
Considering that the foreign exchange reserves of the Central Bank are at a minimum rate, the participation of the State Oil Fund in currency markets is expected to shrink significantly compared with previous years. Moreover, as expectations dictated, the oil price is going to fall further rather than to rise, the decline of national currency is predicted to be steady.
The real sector used to be in accordance with a stable exchange rate regime for a long time, and was not ready for devaluations in 2015. As a result, the real sector faced a large debt burden, people faced increased consumer prices while their incomes fell rather than rose, and the banking sector
faced the threat of default.
3.2 Banking sector
A new economic situation emerging at the last quarter of 2014 was a sign of hardships for banks in the coming year. The rapid decline in oil prices led to a drastic fall in foreign exchange inflows to the country, which in return created a pressure on national currency.
Table 2. The state of banks in the beginning of the year, billion USD
According to the Table 2, external liabilities of banks in foreign currency amount to 11.62 billion USD, while their assets were 6.35 billion USD. To put it another way, there is a shortage of 5.27 billion USD. It can be concluded that, banks were vulnerable to any possible devaluation from the beginning of 2015. Thus, the 33.4%37 devaluation by the Central Bank resulted in a loss of 1.33 billion USD in the banking sector. It means that borrowers having credits in foreign currency had to pay 33.4% more in terms of national currency, decreasing credit repayment ability of customers, and therefore increased problem loans.
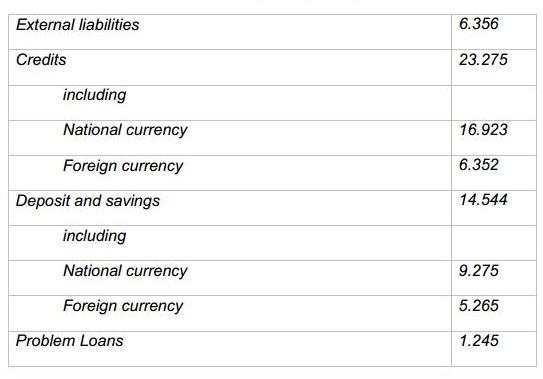
Table 3. The indicators of the banking sector after the devaluation on 21.02.2015, billion USD
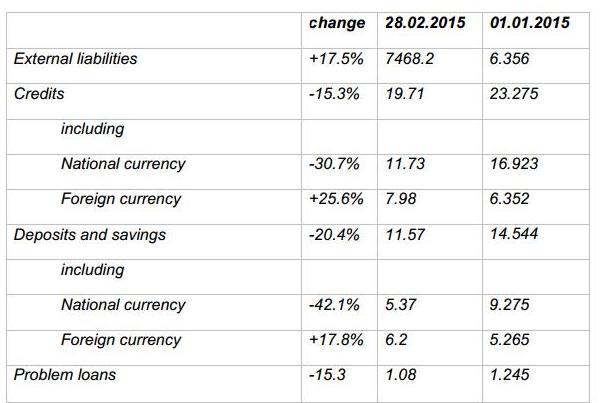
As it can be seen from the table above, the devaluation in February increased external liabilities, credit portfolio in foreign currency, and deposits in foreign currency by 17.5%, 25.65 and 17.8% respectively. Subsequently, some sustained positive dynamics across these three categories were
replaced by a significant contraction. In addition, the February devaluation led credits to grow by 30.7%, while decreasing deposits by 42.1% simultaneously in terms of national currency. Consequently, in the structure of credits, the share of credits in foreign currency rose from 27.3% to
40.5%.
The deepening of THE economic recession and the problems in the banking sector had negatively influenced the dynamics of credits after the devaluation. As a result, at the end of November 2015, the credit portfolio of banks d by 24.4% or by 5.67 billion USD, being 17.6 billion USD. Moreover, the lower level of confidence in the banking sector resulted in declined deposits and savings, together with shifting the structure of currency. That is to say, the amount of savings in November was 11.67 billion USD, falling by 19.8% compared with the beginning of the year. At the same time, the share of savings in foreign currency in total savings rose to 68.5%38.
This increasing share of deposits and savings in foreign currency led banks to offer their credits in foreign currencies. Because of the possibility of next devaluation, businesses failed to attract credits in foreign currency leading to the shrinking credit portfolios in the last decade. To put it another way, following the devaluation, banks were not interested in providing credits in national currency, while customers wanted to avoid credits in foreign currency.
Diagram 10. The Volume of Credits, billion USD
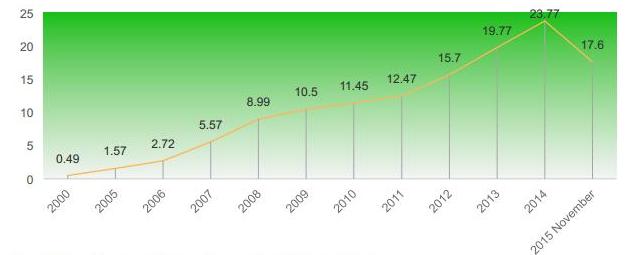
As illustrated in the Diagram 10, during the period 2000-2014 the amount of credits increased more than 48 times. This increase is accelerated following the opening of the BTC pipeline, but a stagnation episode was recorded during 2008-2011 due to Global Financial Crisis. Subsequently, an
improvement was observed during the next three years, but in 2015 again the trend was reversed into negative.
Furthermore, a negative impact on banks assets also was recorded. That is to say, while banking assets increased by 7.4 times reaching to 32.1 billion USD during the 2006-2014, during the 11 months of 2015 they were 27.2 billion USD falling by 15.3%39. In other words, the process of shrinking of banking sector has started. According to some experts, many banks are likely to cease their operations because of either bankruptcy or consolidation. Currently, 7 out of 45 banks operating in the country are under liquidation40.
It should be noted that, while the Central Bank used to disclose the data about the financial reportsrevenues and expenses- of banking sector on a monthly basis in previous years, following the February devaluation, it ceased to do so41. Considering the major source of revenues for banks are
interest revenues, the shrinking credit provision will result in a considerable decline in banking revenues. According to the information available at the end of 2014, 72.7% of banking revenues are attributed to the interest revenues.
3. Economic crisis and reforms
The resource dependence resulted in the biggest crisis of the century in 2015. The economic management, based on fuel revenues for a long period of time, encountered unanticipated situation as a result of drastic fall in oil prices. During previous years ineffective policies directed to the development of non-oil sector, as well as, economic bubbles generated through spending oil are considered main factors deepening the crisis.
Notwithstanding severe social and economic consequences, the crisis called for new challenges, especially the necessity of economic reforms in the country. The country has diverged from free market principles as monopolistic tendencies and civil servants in business environment have been
dominant for a long period.
Thus, 2015 can be considered to mark the beginning of economic reforms. The speech by the head of state in the conference about the social and economic outcomes of 9 months of 2015, underlined paying more attention to real sector, removing external barriers to business, and restraining the
extent of activities of civil servants. Even though the procedures are at a slow pace, the withdrawal of licensing rights from various authorities; as well as the elimination of some, and the transfer of the other to the State Service for Public Service and Social Innovations under the President of the
Republic of Azerbaijan (ASAN service) can be considered a first attack to monopolistic tendencies43. In other words, when provided by previous authorities, licensing procedures were associated with subjective approaches and leading to the creation of monopolies, while new rules intend to
overcome this.
The elimination of monopolies in customs is considered to be an important consequence of the crisis. That is to say, the decision about the elimination of brokerage companies that had de-facto control over import-export transactions by embodying the interests of monopoly groups, was perceived as serious stride in reforming customs by business. Many experts consider “economic liberalization not viable without reforming in customs sector”. It should be noted that, the country relied on imports in terms of raw materials and final consumption products, in which the presence of monopolies caused serious losses for citizens and real sector. In general, reforms such as economic liberalization, improving non-oil sector, creating efficient
operating environment for internal and external investors by restoring confidence, eliminating monopolies and minimizing bureaucrat-business relations, structural reforms are considered to be the ways out of crisis.
Though the government is currently cautious about extending its reforms, the complexity of the situation is clear and the former practices are no longer in effect. That is why we consider that this crisis will lead to economic and structural changes in the country. If reforms are consistently
implemented, investment inflows will be accelerated, the economic activity will rise and the resource dependence will escape in the context of growing non-oil sector.
Conclusion
In conclusion, the year 2015 was not fortunate for the economy of the country. Plunging oil prices in the world markets were reflected in macroeconomic indicators in the short-term. To begin with, the government was forced to abandon the fixed exchange rate regime. The national currency of manat lost its value by 50% during the reporting year (30.12.2015, 1 USD=0.7844 AZN, 30.12.2015, 1 USD = 1.5594 AZN).
The exchange reserves of the Central Bank decreased by 8.74 billion USD, being around 5 billion for the first time since August, 2009. To put it another way, the amount spent by the Central Bank in 2015 alone, was equivalent to what had been accumulated during 5 years.
Furthermore, there was a significant decline in the GDP and GDP per capita, decreasing by 27.7% and 30.4% respectively. In other words, the former fell to 54.35 billion USD (or 54.4 billion AZN increasing by 1.1%), while the latter to 3,657 USD (or 5703.7 AZN decreasing by 0.1%). It should be
noted that, last time the GDP per capita was around this number back to 2007. The decreasing revenues in the state budget led to cut government spending, and as a result, at the end of the year the revenue side of the budget was conducted with a fall of 11.8%, while the spending side with 15.7%. During the last decade, the major driver of the economic growth was the budget spending.
With regard to the income of population, 2015 was not fortunate either. That is to say, although the income per person rose by 4.5% in terms of national currency, reaching to 4380 AZN, it fell in terms of dollars by 25.5%, being 4268 USD, which was recorded in 2011 last time. Moreover, the average monthly wages in the country increased by 4.5% in terms of manats, being 462 AZN, but decreased in terms of dollars by 24.5%, being 450.2 USD. The economic contraction affected negatively to the labour market as well. Based on the information by the Statistical Committee, the number of paid workers fell by 0.8%. But the CESD reports that, the contraction in labour market is underestimated in official data, referring to the extent of shadow economy.
Exports saw a fall of 33.4% in the context of plunging oil prices, and as a result, the trade balance worsened by 5.7 times compared with previous year. Thus, a positive trade balance of 12.2 billion USD in 2014 fell to almost 2.2 billion USD in 2015. The investment environment was also affected by the economic contraction. That is to say, during 2015 the total amount of investment inflows declined by 28.3%, foreign and domestic investment falling by 14.5% and 38.3% respectively.
The falling revenues of the State Oil Fund created difficulties in meeting their obligations. The devaluation helped to mitigate the burden of the Fund; transfers from the Fund to the state budget were 27.7% lower. Nonetheless, the depletion of the funds was inevitable, falling to 34.7 billion USD in 2015.
The banking sector experienced serious problems due to the sharp devaluation. Since the credit repayment ability of households and businesses declined, leading to higher problem loans, banks became more cautious in their lending policies. Consequently, the value of credits decreased by 6.2
billion USD or by 26% comparing with previous year. It should be noted that, expanding credit portfolios compensated for the lack of annual capital to some extent, which had a positive influence on the economic activity. Contractionary policies of the banking sector as well as government furthered economic tensions during the year.
On the whole, inadequacy of policies directed to reduce resource dependence, an artificial growth based on large-scale oil revenues, inefficient expenditures, as well as, the failure in forming freemarket principles during 25 years (following the collapse of the USSR), all resulted in a serious
crisis in 2015. During the first 6 months of falling oil prices, symptoms of crisis commenced to appear.
However, this economic crisis called for first-hand reforms. Unless large-scale economic an structural reforms are implemented, the crisis is anticipated to be aggravated, and therefore, the global status of the country to fall behind. At the same time, the government should reverse
contractionary policies that aim to defend the national currency, with expansionary policy. Expansionary policies will positively affect to economic activity and aggregate demand, and eventually led to potential acceleration of non-oil sector growth, increasing employment, as well as decreasing social burden of government.