Introduction
As we know most of the food products in Azerbaijan are imported from different countries, mainly from Russia, Germany and Turkey. However, there are some firms that produce domestic products, it’s said that, majority of population still prefer foreign products to local ones. We thought to work on this argument. Therefore, we took only one field of food products, which is dairy products, because this field has increased to great extent during recent years. In order to see why people prefer local or foreign dairy products, we put satisfaction level of foreign and local dairy products as our dependent variable. Thus, if satisfaction of foreign or local product is high among the sample of population we choose, it will be explained by independent factors why one consumer chooses local or foreign product. We put six independent factors that can affect satisfaction level of consumers. Here is the methodology we used:
Methodology
In brief, in this project, we will analyze factors that affect our product choice, why we choose local products or foreign ones. Here satisfaction level of products (local/foreign) is dependent variable. The factors, which have impacts on our dependent variables such as “price”, “design”, “advertisement”, “taste”, “brand” , “freshness” are our independent variables. In order to get data, we as a team conducted a survey among 130 people, whereas 70 of them are females and 60 are males. It was an online questionnaire created in Google.docs and it included 12 questions. Our respondents are classified on 5 age groups, also as local and foreign people.
The questions were designed in a way that respondents can answer all the questions related to the topic. Our questionnaire is designed mostly in Likert scale where the answer options are as “Strongly agree”, “Agree” and so on.
Then we apply simple regression analysis for measuring how each of these 6 independent variables has an impact on our dependent variable and interpreted the results. We did our regression analysis in STATA. Then we did hypothesis testing in order to understand whether we can apply our sample results to real population or not. We tried to prove our 5 hypotheses. We used both Excel and STATA for hypothesis testing.
Results and Analysis
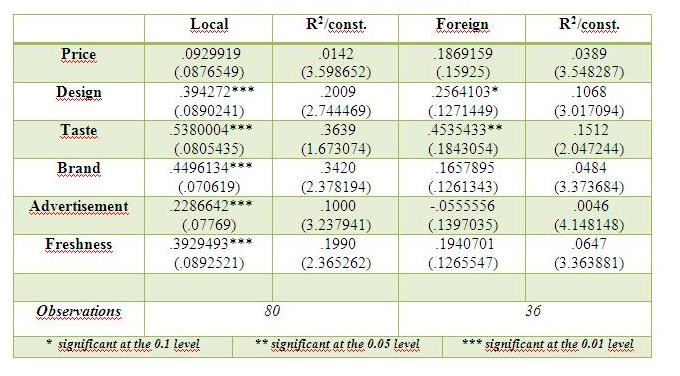
We did all regression analysis (simple linear regression) on STATA and these are the results we got. The first table below shows overall results of our regression analysis.
Table 1
Satisfaction level of local dairy product based on price
In our simple linear regression analysis we took “Price” as an independent variable, whereas “Satisfaction Level” was dependent variable and “local product” was the preferred category of consumers. The regression between independent variable “price” and dependent variable “satisfaction level” is not significant because p-value of data is 0.292, which is more than α=0.1, α=0.05, α=0.01.
Satisfaction level of local dairy product based on design
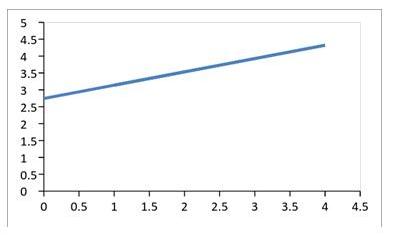
Another independent variable for measuring satisfaction level of local dairy products is “Design”. As p-value of data is equal to 0 (zero) and it is less than α=0.1, α=0.05, α=0.01, the regression between independent variable “design” and dependent variable “satisfaction level” is significant at the 0.01 level . R-squared is 0.2009, which implies that only 20% of the changes in “satisfaction level” can be explained by “design” of the local dairy product. Our slop is 0.394272(b1), which means that change in independent variable “design” for 1 unit can lead to a change in “satisfaction level” by this amount. As the number is positive, it means that there is a positive correlation between these two variables.
Y=b 1 xX + const. Satisfaction level = 0.394272 x “Design” + 2.74469
Satisfaction level of local dairy product based on taste
The regression between independent variable “Taste” and dependent variable “Satisfaction Level” is also highly significant, because p-value of data is equal to zero and zero less than α=0.1, it also means that the significance is in the highest level. R-squared is 0.3639, which means that the 36% of change in “satisfaction level” can be explained by “taste” of local dairy product. We also can say that change in our independent variable “taste” can lead to a change in dependent variable by 0.5380004 (b1) and there is a positive correlation.
Y=b 1x X + const. Satisfaction level = 0.5380004 x “Taste” + 1.673074
Satisfaction level of local dairy product based on brand
Here we take “Brand” as an independent variable, “Satisfaction Level” is dependent variable and “local product” is the preferred category of consumers. The regression between independent variable “design” and dependent variable “satisfaction level” is significant because p-value of data is 0 (zero), which is of course, less than α=0.1, α=0.05, α=0.01. R-squared is 0.3420, which shows that the 34% of change in “satisfaction level” can be explained by “brand” of local dairy product. Additionally, change in our independent variable “brand” can lead to a change in “satisfaction level” for 0.4496134 and there is a positive correlation between them.
Y=b 1x X + const. Satisfaction level = 0.4496134 x “Brand” + 2.378194
Satisfaction level of local dairy product based on ads
This is the table of regression between independent variable “Ads” (advertisement) and dependent variable “satisfaction level” on the category of “local dairy products”. The regression between independent variable “ads” and dependent variable “satisfaction level” is highly significant because p-value of data is 0.004, which is less than α=0.1, α=0.05, α=0.01. R-squared is 0.1, which shows that the 10% of change in “satisfaction level” can be explained by “ads” of local dairy products. We also can add that, change in our independent variable “ads” can lead to a change in “satisfaction level” for 0.2286642 and there is a positive correlation between them.
Y =b 1x X + const. Satisfaction level = 0.2286642 x “Ads” + 3.237941
Satisfaction level of local dairy product based on freshness
Here “Fresh” (freshness) is an independent variable, “Satisfaction Level” is dependent variable and “local product” again is the preferred category of consumers. The regression between independent variable “fresh” and dependent variable “satisfaction level” is significant because p-value of data is 0 (zero), which is less than α=0.1, α=0.05, α=0.01. R-squared is 0.1990, which shows that the 20% of change in “satisfaction level” can be explained by freshness of local dairy products. Additionally, change in our independent variable “fresh” can lead to a change in “satisfaction level” for 0.3929493 and there is a positive correlation between them. Y=b 1 x X + const. Satisfaction level = 0.3929493 x “Fresh” + 2.365262
Satisfaction level of foreign dairy product based on price
Then we measured the satisfaction level of consumers who prefer foreign dairy products. We took “Satisfaction level” as a dependent variable and “foreign product” as a preferred category of consumers, in this table the independent variable is “Price”: As p-value is 0.249, which is more than α=0.1, α=0.05, α=0.01. It means that we cannot claim significant relationship between price and foreign dairy product satisfaction level.
Satisfaction level of foreign dairy product based on design
We take “Design” as an independent variable and make a regression between dependent variable of “Satisfaction level” and this independent variable; “foreign product” is again the preferred category. The regression between them is significant at the 0.1 level, because the P-value of data is 0.052, which is less than only α=0.1. R-squared is 0.1068, which means that only 10% of the change in “satisfaction level” of foreign dairy products can be explained of the change in “Design” o these products. Also, there is a positive correlation between these variables and one unit change in our independent variable “design” can lead to a change in “satisfaction level” of foreign dairy products by 0.2564103.
Y==b 1 x X + const. Satisfaction level = 0.2564103 x “Design” + 3.017094
Satisfaction level of foreign dairy product based on taste
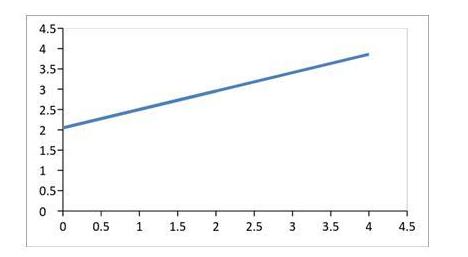
Another independent variable is “Taste” and the regression between “Taste” and independent variable of “Satisfaction level” in the foreign dairy products category is significant in the 0.05 level, because p-value of the data is 0.019, which is less than α=0.5. R-squared is 0.1512, which means that 15% of change in “satisfaction level” of foreign dairy product consumers can be explained by the “Taste” of the product. There is a positive correlation between these two variables and as B1 is 0.4535433, we can say that, the change in our independent variable “taste” can lead to a change in “satisfaction level” of foreign dairy products in this amount.
Y==b 1 x X + const. Satisfaction level = 0.4535433 x “Taste” + 2.047244
Satisfaction level of foreign dairy product based on brand
Now the independent variable is “Brand”, dependent variable is “Satisfaction level” and foreign dairy product is preferred category of the consumers. As p-value of the data is 0.198, which is more than α=0.1, α=0.05, α=0.01. From here we cannot claim the significant relationship between brand and foreign dairy product satisfaction level.
Satisfaction level of foreign dairy product based on ads
The regression between independent variable of “Ads” (advertisements) and dependent variable of “Satisfaction level” on the category of the foreign dairy products is not significant, because the p-value of the data is more than α=0.1, α=0.05, α=0.01 and equal to 0.693. From here we cannot prove that there is significant relationship between advertisement and satisfaction level of foreign products.
Satisfaction level of foreign dairy product based on freshness
The regression between independent variable of “Fresh” (freshness) and dependent variable of “Satisfaction level” on the category of foreign dairy products is not significant also, because the p-value is more than α=0.1, α=0.05, α=0.01 and equal to 0.134.
After analyzing our data we see that in both local and foreign products choice taste plays the most important role. Before starting hypothesis analysis we did some interesting analysis referring to our questionnaire results:
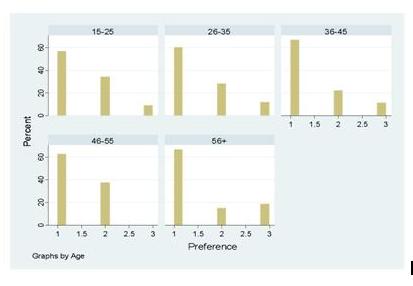
The graphs illustrate how preference on local, foreign and homemade products changes among different age groups. Here 1 stands for local, 2nd for foreign and 3rd columns for homemade products. Survey results indicate that consumption of local products is dominating among all age groups. Foreign products gain the second place in all age groups besides 56+ aged people. They prefer homemade dairy products to foreign ones and they consume homemade products more than others. The other interesting fact is that 46-55 aged people do not consume homemade products. Foreign products are mostly consumed by people who are aged 46-55. It can be explained that, as in the Soviet period local products were not competitive and people used to buy imported goods mostly, now they do not rely on local products.
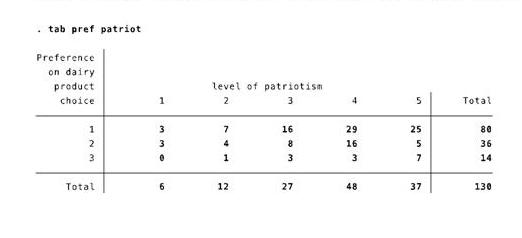
Table shows how patriotism level of people affects preference on local, foreign and homemade products. People who agree that they are very or somehow patriotic prefer local products. It means that there is a positive relationship between patriotism and consumption of local dairy products. People who are patriotic prefer spending their money on local goods rather than foreign ones which indicates that level of patriotism somehow affects respondents’ purchasing decisions. It is obvious that people who are very patriotic are sensitive in consuming local products.
In our survey 16 foreign people participated. Interesting fact is that 43,75% of these people consume local products and 56,25% consume foreign ones. According to this result we can say that foreign people consume foreign products more than local ones. Maybe this result is not so reliable. Because the number of the foreigners is not representative.
Hypothesis Testing
A hypothesis is a statement that provides a possible explanation for an event or phenomenon. It is not a statement of opinion; it is a statement that can be tested. We put 5 claims according to our sample results and tried to prove them. The first three of them are directly related with our research purpose. Because we want to find out whether local dairy product consumers are more satisfied or vice versa. We did the last two hypotheses just for our interest. We will explain our reason afterwards.
- Local and foreign product consumers
H0: µlocal – µforeign=0
H1: µlocal – µforeign<0
As a group we would like to check: People who consume local products are less satisfied than the foreign product consumers. Our first step is to do F-test in order to find whether population standard deviations are equal or not. Sample mean of local product consumers’ satisfaction is 3.9125 with standard deviation 0.8448 and foreign product consumers’ mean is 4 with standard deviation 0.8280.
As our F0.05,79,35>F (where F=1,0409 and F0.05,79,35=1.65) our population standard deviations are equal. In our second stage we do t-test in Stata and Excel and as our P-value (0.3023) is larger than alpha which is equal to 0.05 (as confidence level is 95%) we fail to reject our null hypothesis H0: µfemale – µmale =0. That’s why we cannot claim our hypothesis that, people who consume local products are less satisfied than the foreign product consumers.
- Female satisfaction on foreign and local products
H0: µfemale/local – µfemale/foreign =0
H1: µ female/local– µ female/foreign<0
According to our sample results we claim that females’ mean satisfaction who consume local products (4.0833) with 0.9373 standard deviation is less than females’ who consume foreign ones (4.3571) with 0.7449 standard deviation. For this hypothesis we also follow the same steps as in the first hypothesis.
First step: According to F=1,583168 F0.05, 35,13=2.36 we find out that population standard deviations are equal.
Second step: As P value (0.1666)>α (0.05) we fail to reject our null hypothesis H0: µfemale/local – µfemale/foreign =0. Therefore we cannot claim that females who consume local products are less satisfied than the ones who consume foreign products.
- Male satisfaction on foreign and local products
H0: µmale/local – µmale/foreign =0 Standard devmale/foreign=0.8125 Sample meanmale/local=3.79
H1: µ male/local– µ male/foreign>0 Standard dev male/local=0.7428 Sample meanmale/foreign=3.77
Our hypothesis is that males who consume local products are more satisfied than males who consume foreign ones. We follow the same steps as in 1st and 2nd hypothesis and according to the numbers below by not rejecting null hypothesis we cannot prove our alternative hypothesis.
| F=1,19639844 F0.05,21,43=1.81 P-value=0.5 > α=0.05 |
- Female and male satisfaction on local products
Mean satisfaction of females who use local products is more than satisfaction of males who use the same type products.
H0: µ female/local – µmale/local =0 Standard devfemale/local =0.93732 Sample meanfemale/local=4.08
H1: µ female/local– µ male/local>0 Standard dev male/local=0.7428 Sample meanmale/local=3.79
| F=1,5922 F0.05,35,43=1.69 P=0,0511> α=0.05 |
We fail to prove our hypothesis that mean satisfaction of females who use local is more than satisfaction of males who use local products.
- Female and male satisfaction on foreign products
H0: µ female/foreign – µmale/foreign =0 Standard dev female/foreign=0.7449 Sample meanfemale/foreign=4.36
H1: µ female/foreign– µ male/foreign>0 Standard dev male/foreign =0.8125 Sample meanmale/foreign=3.77
Hypothesis: Mean satisfaction of females who use foreign goods is more than males who use the same type ones. As our P value is 0.0185 is less than α=0.05 we can reject our null hypothesis and prove our alternative hypothesis, which means satisfaction of females who use foreign product is more than males who use the same type. We mentioned that we did last 2 hypotheses for interest. We know that there is a statement: It is impossible to satisfy females. That’s why we wanted to compare satisfaction level of males and females on the same type product. Although we cannot claim anything according to 4th hypothesis, due to the 5th we got the result which satisfies us as a group of females. We disproved the statement above. It means that actually males are less satisfied than females with the products that they choose themselves.
Conclusion
To conclude, as a result of our investigation we found that several variables has an impact on satisfaction level of consumers who choose local and who choose foreign products. Some of the factors’ influence is highly significant and some of them are not. According to 1st hypothesis we see that satisfaction of local product consumers is not less than foreign product consumers, according to the 2nd hypothesis we observe that females who consume local products are not less satisfied than the ones who consume foreign dairy products. Therefore why should not we buy local products? Why should we contribute to any country’s state budget not ours? That’s why let’s give chance to our local products which are competitive at least once. Because 1. Local food is better because of freshness 2. Local food is safer 3. Local food is an investment for the future. Buying more local products mean less unemployment, high GDP which leads to high economic growth rate. Let’s buy local products and contribute to our homeland-“Hamı yerli mal alsın, xeyir vətənə qalsın”.
By: Zeynab Abdullayeva, Narmina Mahmudova, Fidan Sideifzada, Leyla Abbasli
 Oval Useful news from Azerbaijan and Caucasus